
Do you worry about the performance of your web resources, and is your server lagging constantly?
In such a case, this post would be worthy. Below, we will review the top server monitoring tools available in 2025 so you can improve server performance.
NewGen technology, called server monitoring, allows you to monitor your IT infrastructure and other systems to ensure your servers are up and running 24/7.
Let’s read about server monitoring, which is only for readers who need to know it.
What tools or software are used for server monitoring?
In other words, server monitoring software is a collection of technologies that scan servers or the system, identify problems, notify users, and even resolve technical issues through self-healing.
Its simple Dashboard allows the user to monitor the performance of the CPU or other site resources, record the server metrics, and quickly resolve problems.
5 Top Server Monitoring Tools & Software for 2025:
Having stated that, allow us to compile a list of the top server monitoring solutions for 2024 that provide rapid issue detection, notifications, and server issue self-healing.
To provide the readers with a better understanding of the tool’s operation, we have also covered the main features, use cases, and pricing plans of each. Let us then begin
1) Nagios
The IT infrastructure monitoring system Nagios offers one of the best server monitoring tools available to help users find and fix technical issues. As stated, Nagios monitors the state and functionality of your server and enables users to resolve problems immediately. It monitors every aspect of your IT setup to guarantee the smooth operation of business apps and technical platforms.
Main Features
- Fast Support: Nagios alerts the technical support staff to system failures to guarantee a round-the-clock solution.
- Network Analyzer: Thanks to Nagios’s grade NetFlow Data analysis capability, users may quickly check the bandwidth status to determine whether it is dropping.
- Centralized Dashboard: Nagios’s Dashboard enables the user to track the operation of servers and other hardware and make real-time fixes.
- Must-Have Nagios AddOns: From a remote plugin executor and cross-platform monitoring agent to a server checker and data processor, Nagios provides every utility as a free or paid add-on.
Also Read: 10 File Server Cloud Storage – Free Storage & Sharing Options of 2024
Case Studies
- The server monitoring software Nagios helps users monitor the server log and stop security breaches and malware attacks, keeping the server safe and healthy.
- Gamers can use Nagios’ Network Analyser to check network traffic and bandwidth and ensure uninterrupted gaming.
Pricelist
- Contacting the support staff is possible for custom plans and demo trials—nagios; however, it just bills for support and maintenance services.
- Checking status and resolving problems are free essential server monitoring services. Support and maintenance costs $1963 a month (100 Nodes).
Features and Drawbacks
Positive aspects
- Request Demo
- Total hardware monitoring from one location.
Limitations
- There are services for paid support.
2) The Promethean
Among the most excellent server monitoring tools, Prometheus is made especially to provide cloud server monitoring and other server-examining features. Real-time measurement of metrics is another feature that enables administrators to handle problems properly.
Furthermore, Kubernetes, which controls containers for efficient application running, may be monitored with Prometheus. Because Prometheus offers such excellent service quality, cloud users searching for a server monitoring solution can choose it without hesitation.
Main Features
- Accurate Alerting: Prometheus alerts the developers to the performance of the servers or containers so they may address the problem right away.
- For more functionality, leverage System Stats, Docker, HAProxy, StatsD, and other integration technologies in conjunction with the Prometheus server monitoring tool.
- Simple Operation: Prometheus is one of the ideal server monitoring solutions for users because of its simple operations and features.
- Enables Customization: The monitoring resources may be readily scaled and customized by users according to their needs.
Case Studies
App developers check the performance metrics of server applications and track the response time. Tech support staff members use Prometheus’s Server monitoring tool and RDP to track the performance of the client’s servers. Developers use Prometheus to collect Kubernetes’ numeric metrics to run applications effortlessly in a containerized environment.
Pricelist
Prometheus provides all server monitoring features completely free of charge. Access the tools on the official website.
One may obtain server monitoring tools from the website.
Gains and Drawbacks
Rewards
- Download for Free (No Further Charges)
- Seamlessly functions in a cloud setting.
The drawbacks
- The official website offers no help services.
3) DATADOG
Cloud server monitoring tool DataDog is among the best IT infrastructure monitoring solutions.
It provides monitoring services, from error tracking to database monitoring to workflow automation, log management to server security, and network monitoring. DataDog also provides One Dashboard for tracking the server’s hardware performance. The DataDog monitoring tool can also greatly benefit a cloud setting.
Main Features
- Cloud server friendly: DataDog provides cloud server monitoring to make sure that tracking may be done simply in cloud settings.
- One DashBoard: This tool aids developers in identifying and resolving problems by displaying all hardware activity in real-time.
- Track your User Experience: Track your user experience with an intuitive web recorder, get notifications, and find performance problems.
- Sync business decisions with performance measures: DataDog allows users to include performance frontend and backend measurements into business decision measures.
Case Studies
The cloud-friendly analytics of DataDog make it one of the top server monitoring platforms for SaaS and cloud providers. Gamers and developers can use the tool to identify and resolve server loading problems. App builders can access an interactive real-time dashboard with high-resolution metrics, and users can get alerts via email and Slack.
Prices
Free trials are available with a few restrictions (you must contact the tech support staff). Users can even customize the DataDog Monitoring plan.
The serverless workload monitoring plan starts at $5 a month, and the serverless APM (AddOn) is only $10 a month.
Positives and Negatives
Pluses
- Friendly User Interface.
- One centralized Dashboard.
Limitations
- The limitations of free trials are few.
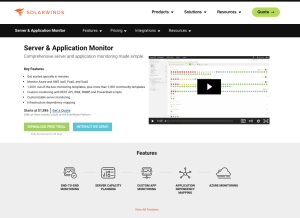
4) SolarWinds Server & Application Monitor
SolarWinds is unique among server monitoring tools for multi-cloud observability, database, and server administration because of its smooth application monitoring, cutting-edge observability platform, and many tool connectors, which elevate the server tracking process. Multi-vendor network monitoring loaded with intelligence mapping and sophisticated alerting is available from SolarWinds.
Main Features
- Easy Integrations: For more efficient performance monitoring procedures and real-time server health detection, SolarWinds permits multiple tool connections.
- Secured Design: Your servers are protected against internet attacks by the interface’s design, which complies with the most recent security standards.
- NexGen Intelligence: Using AI/ML intelligence, get reliable and accurate data together with valuable insights to assist the user in fixing problems more quickly.
- Hybrid Cloud Observability: BandWidth analysis and configuration management are also included with network and infrastructure monitoring and observability from SolarWinds.
Case Studies
Government agencies should monitor and manage the digital infrastructure environment safely, even by offering a full-stack monitoring facility. Small and medium businesses can use server monitoring tools to fix issues without compromising workflow. DevOps can benefit from seamless monitoring solutions to improve visibility, remove cyber barriers, and automatically report assets.
Costing
SolarWinds’ official website needs to provide its pricing structure; one must contact the support staff to schedule a demo or obtain an estimate.
Get a SolarWinds Sales Team Free Demo Trial for a few days.
Positives and Negatives
The advantages
- Support is available around-the-clock through LiveChat
- Best Public Sector Monitoring Plan (Complete Stack Monitoring Facility)
Limitations
- Plans and Prices are not open.
5) Dynatrace
Among AI’s most excellent application monitoring tools for completing most IT-related tasks is DynaTrace, a unified observability and highly secure monitoring solution. Furthermore, DynaTrace provides full-stack monitoring so that users may perform performance analysis before making any business decision. Before problems seriously affect the user’s servers, DynaTrace finds and fixes them.
Main Features
- Manage Real User Experience: Using real-time monitoring, prompt red alerts, and rapid issue resolution, this feature improves user experience.
- Auto detects cloud server dependencies: It monitors the cloud infrastructure using DynaTrace’s Davis AI to help prevent significant deteriorations that could affect the server’s overall functionality.
- Get complete observability on all clouds, including OS-level and important network data, to quickly monitor hybrid multi-cloud and identify issues.
- Proactively resolves problems: DynaTrace provides complete transparency in performance metrics and monitors the virtualized server environment.
Case Studies
Some of the best ways financial companies can provide a digital experience that satisfies customer demands are secure observability, application security, and AIOps, all under one platform. Government agencies can use Dynatrace to manage cyber risks and guarantee zero-error mission execution for military campaigns or civil needs. App developers executing tasks in packets called containers and Kubernetes managing these containers can use DynaTrace for back-to-back container monitoring services.
List of prices
While DynaTrace provides Free Trials on premium plans to assist Small Businesses in using monitoring services, the premium plans begin at just $0.8 per hour.
Users can even communicate with the sales team to create a customized plan. Log Server administration costs $0.20 per GB, and daily costs $0.07 per GB.
Positives and Negatives
Pros
- Price and Plans are Extremely Flexible (Hourly Plans are Available).
- Tool for app developers monitoring containers.
The drawbacks
- The operation of the Support Service could be more flawless.
Verdict
KPIs for your company might be elevated with server monitoring. It continuously checks every aspect of your IT infrastructure to make sure your server operates effectively around the clock. Selecting the best server monitoring solution that ideally meets their business requirements could be difficult for users.
Believe us, consider this content to be your mentor! Select the server monitoring software—like Dynatrace or Prometheus—that provides a cloud-based running environment, fast alarms, and a fully configurable dashboard.